The world of cryptocurrency investing can seem overwhelming, especially when you’re faced with price charts full of lines, candlesticks, and unfamiliar terms. Yet, for anyone looking to make informed investment decisions, understanding how to read cryptocurrency charts and apply the basics of technical analysis is absolutely crucial. Whether you’re new to digital assets or looking to improve your trading strategy, mastering these skills can help you identify market trends, spot potential entry and exit points, and manage risk more effectively.
In this guide, we’ll break down the fundamentals of cryptocurrency chart reading and technical analysis. We’ll explore the key chart types, essential indicators, and how to interpret patterns, all supported by real-world examples and recent data. By the end, you’ll have a strong foundation to approach crypto markets with greater confidence.
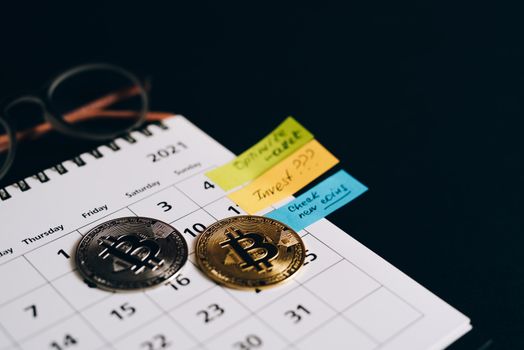
The Importance of Chart Reading in Crypto Investing
Unlike traditional markets, cryptocurrency trading operates 24/7 and is known for its volatility. In 2023, Bitcoin’s price ranged from $16,500 in January to over $42,000 by December—a swing of more than 150%. Such rapid changes make it vital for investors to have tools that help them understand not just what’s happening, but why.
.png)
Technical analysis is the study of past market data, primarily price and volume, to forecast future price movements. While fundamental analysis looks at the underlying value of a project, technical analysis focuses on what the market is doing right now. For crypto investors, this means learning to “read the charts” is more than just a skill—it’s a survival tool.
Key benefits of learning to read crypto charts include: - Identifying trends early - Timing buy and sell decisions - Managing risk through stop-losses and entry points - Gaining independence from hype and news cyclesCandlestick Charts: The Foundation of Crypto Technical Analysis
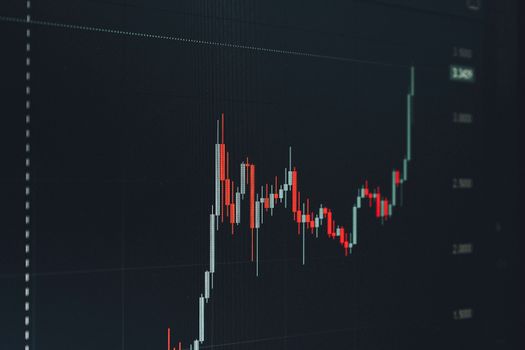
The most popular chart type in cryptocurrency trading is the candlestick chart. Each “candle” represents a set time period (e.g., 1 hour, 1 day) and shows four critical data points: open, high, low, and close prices.
For example, if you look at the daily candlestick chart for Ethereum, each candle shows where the price started (open), the highest and lowest price reached, and where it ended (close) for that day.
Candlesticks are color-coded, usually green (or white) for price increases and red (or black) for price decreases. The body of the candle represents the open-to-close range, while the “wicks” or “shadows” show the highest and lowest prices reached.
Key candlestick patterns include: - Doji: Signifies market indecision, with open and close prices nearly equal. - Hammer: A bullish reversal pattern with a small body and long lower wick. - Engulfing: When a larger candle completely engulfs the previous candle, indicating a potential reversal.Understanding these patterns can help investors anticipate market moves. For instance, a series of green “bullish engulfing” candles after a downtrend may signal a reversal and buying opportunity.
Popular Technical Indicators: Tools for Deeper Insight
While candlestick patterns give visual clues, technical indicators provide mathematical analysis of price and volume. Here are some of the most commonly used indicators in crypto trading:
1. Moving Averages (MA) - Simple Moving Average (SMA): The average price over a set period (e.g., 50-day SMA). - Exponential Moving Average (EMA): Gives more weight to recent prices, responding faster to price changes. - Example: If Bitcoin’s 50-day EMA crosses above its 200-day EMA, this is known as a “Golden Cross” and often signals bullish momentum. 2. Relative Strength Index (RSI) - RSI measures momentum on a scale of 0 to 100. - Readings above 70 indicate overbought conditions (potential for price drop). - Readings below 30 indicate oversold conditions (potential for price rise). - Fact: In a 2021 study, RSI was found to predict short-term price reversals in Bitcoin with up to 68% accuracy. 3. Volume - Volume shows how much of a cryptocurrency was traded in a given period. - Spikes in volume often accompany major price moves, confirming the strength of a trend. 4. MACD (Moving Average Convergence Divergence) - Shows the relationship between two moving averages. - MACD crossovers can signal when to buy or sell.Here’s a quick comparison of the most popular indicators:
| Indicator | Main Purpose | Key Signal | Typical Use Case |
|---|---|---|---|
| Simple Moving Average (SMA) | Trend direction | Price crossing MA | Identifying support/resistance |
| Relative Strength Index (RSI) | Momentum/Overbought-Oversold | Above 70 or below 30 | Spotting reversals |
| MACD | Trend changes | Line crossovers | Timing entry/exit |
| Volume | Trade activity | High/low spikes | Confirming breakouts |
Support, Resistance, and Trendlines: Reading Market Psychology
Support and resistance are fundamental concepts that chart readers use to understand where buying and selling pressure exists.
- Support: A price level where demand is strong enough to prevent the price from falling further. - Resistance: A price level where selling is strong enough to keep the price from rising.For example, in early 2024, Bitcoin found strong support around $38,000—the price bounced upward each time it approached this level. Resistance was encountered near $45,000, where the price struggled to break higher.
Trendlines are diagonal lines drawn on a chart to connect a series of highs or lows. They help visualize the direction (uptrend, downtrend, or sideways) and strength of the trend.
- An uptrend is marked by higher highs and higher lows. - A downtrend is marked by lower highs and lower lows.Drawing these lines on a chart can help investors identify when a trend is strengthening, weakening, or about to reverse.
Chart Patterns: Recognizing Opportunities and Risks
Beyond individual candles and indicators, certain price formations called “patterns” can signal future price movements. Here are some of the most recognized patterns in crypto trading:
1. Head and Shoulders - This reversal pattern consists of three peaks: a higher “head” between two lower “shoulders.” - When the price breaks below the “neckline,” it often signals a trend reversal from bullish to bearish. 2. Double Top and Double Bottom - Double Top: Price hits the same high twice, failing to break higher and often leading to a decline. - Double Bottom: Price hits the same low twice, suggesting a potential upward reversal. 3. Triangles (Ascending, Descending, Symmetrical) - These consolidation patterns occur as the trading range narrows, often preceding a breakout in either direction.According to a 2022 analysis by CryptoCompare, classic chart patterns like “triangle breakouts” had a success rate of over 60% in Bitcoin and Ethereum trading.
Recognizing these patterns is not about predicting with certainty but about increasing the probability of making successful trades.
Volume Analysis: Confirming Trends and Breakouts
Volume is often overlooked by new traders, but it plays a critical role in validating price movements. For instance, a price breakout above resistance with low volume is more likely to be a “false breakout,” whereas a breakout accompanied by a volume surge is more likely to be sustained.
In March 2023, Ethereum surged from $1,400 to $1,800 in just two weeks. This rally was confirmed by trading volume doubling during the breakout, adding credibility to the move.
Key volume concepts include: - Volume spikes: Indicate strong interest and often precede major moves. - Volume dry-ups: Warn of weakening trends or potential reversals.By combining price action with volume analysis, investors can make more informed decisions and avoid common pitfalls.
Managing Risk: The Role of Stop-Loss and Take-Profit Levels
No technical analysis strategy is complete without risk management. Crypto markets are unpredictable, and losses can mount quickly. Setting stop-loss and take-profit levels based on chart analysis can help protect your capital.
- Stop-loss: An order to sell a cryptocurrency if it falls to a certain price, limiting potential losses. - Take-profit: An order to sell when a target profit level is reached, locking in gains.For example, if you buy Bitcoin at $40,000 after identifying support, you might set a stop-loss at $38,500 and a take-profit at $44,000. This discipline prevents emotional trading and helps enforce a risk-reward ratio.
Professional traders often risk no more than 1-2% of their portfolio on a single trade, ensuring that even a string of losses won’t wipe them out.
Final Thoughts: Building Confidence Through Technical Analysis
Learning how to read cryptocurrency charts and apply basic technical analysis is a journey, not a destination. While no method can guarantee profits, understanding the language of charts empowers investors to make rational decisions, minimize risk, and seize opportunities.
Start with the basics: identify trends, spot support and resistance, learn a few key indicators, and practice recognizing chart patterns. Over time, your chart-reading skills will improve, helping you navigate the fast-moving world of crypto investing with greater confidence and success.